20 Years of Work
💭 Project Description
Research and design of a large-scale timeline created for an exhibition that explores factors impacting labour and workers in Canada throughout history, including trade agreements, changes to the law, global financial crises and technology.
The project team included: Christopher Pandolfi and Simon Rabyniuk.
2015, print graphic, 8’ x 4’ panel 1, Workers Arts and Heritage Centre, Hamilton, ON
2015, print graphic, 8’ x 4’ panel 2, Workers Arts and Heritage Centre, Hamilton, ON
To commemorate DoUC’s 10 year anniversary, we have organized an interview series highlighting past DoUC projects.
We wanted to take this milestone opportunity to revisit projects in a fun and reflective way, calling on the perspectives of both past and present DoUC team members. Shifting from objective and brief project descriptions, we revisited our work with a renewed intimacy. With more personality. We hope this series provides deeper insight and understanding to past projects. Or, is simply a fun read!
To help you navigate this series, we recommend first reading the project description for context. Then, you can explore the interview dialogue. Enjoy! 🙃
ℹ️ The 20 Years of Work interview was conducted with Chris Pandolfi (CP) and Simon Rabyniuk (SR).
In your own understanding, what was this project attempting to address?
SR ⤳ We made this project for an exhibition at the Workers Arts and Heritage Centre marking its 20th anniversary. A few years earlier we participated in an exhibition at WAHC. Through that relationship we were invited to produce something new. The exhibition included a wide range of artists whose work, or working methods, critically reflected on labour. Notably Carol Conde and Karl Beveridge, an artist duo I deeply admire, were also presenting work. Our starting question was very simple, “how has work changed over the course of WAHC’s lifetime?” We responded by visualizing a recent history of work. The project is positioned within Canada; although, looks outwards to the globe. Planet, world, globe, while treated as synonyms of course have different connotations. Globe used here refers to the history and practices of empire and economic expansion through trade.
CP ⤳ The project was trying to address a number of different things. First it is important to understand where 20 Years came from. We were asked by the Workers Art and Heritage Centre (WAHC) in Hamilton to be part of their 20th anniversary show (this to me is still an honour I hold very dear. The number of great artists that have exhibited there combined with the fact that the studio was looked at as a contemporary practice that was engaging in work that was looking at issues of labour was something I was and am still very proud of. We have never shied away from the fact that what we do no matter the context is a political act and to have our work shown in the context of the WAHC and for such a special occasion is still very much a highlight of my career) so the 20 Years came from exploring what ‘work’ meant during this time the WAHC was opened.
During this same period the studio was exploring many topics around money, finance and labour. This project gave us an opportunity to understand that these other aspects we were exploring could begin to culminate and expand our thinking by looking at the different systems and understandings of contemporary labour and work.
It should also be mentioned here that I am adamantly against Neo-Liberalism and became interested in how it functions and why it exists, exploring its mutations, evolution and I hope one day its ultimate death. I mention this because I would like people to be aware of my bias and how that bias affects the way things are visualized for a project such as this.
What we wanted to address in my view—and this was a long time ago—was this idea of the recent changes and shifts of how we view labour through statistics and how those statistics are representative of the way the economy values work and not necessarily how people value work. This work was also done at an interesting time because it straddled the end of the 20th century and the beginning of the 21st or, in another view, the end of one millennium and beginning of another. A very special thing…
“We, as a studio, understand that connections are important, but the relationships between those connections are what reveals situations to help us better understand why the world is constructed and more importantly for who it is constructed.”
Why did you choose to explore factors impacting labour and workers in Canada throughout history using trade agreements, changes to law, global financial crises, and technology?
CP ⤳ We never explore just one factor and we never try to use just data or just information to tell a story. We as a studio understand that connections are important, but the relationships between those connections are what reveal situations to help us better understand why the world is constructed and more importantly for who it is constructed. Working at different scales in each of these topics allows us to show how an international trade agreement has a direct impact on communities and individuals and the power dynamics that exist in those relationships. The studio is always interested in the idea of power and how power communicates and how power controls. These factors that we chose would allow us to explore power and further investigate its tools. These factors are the tools of power and understanding how they are controlled is essential to understanding why things are the way they are. Very simply, the infrastructure of power and how it is used to control existence is a project that is too old to imagine, but very easy to change (if we want), once you see it.
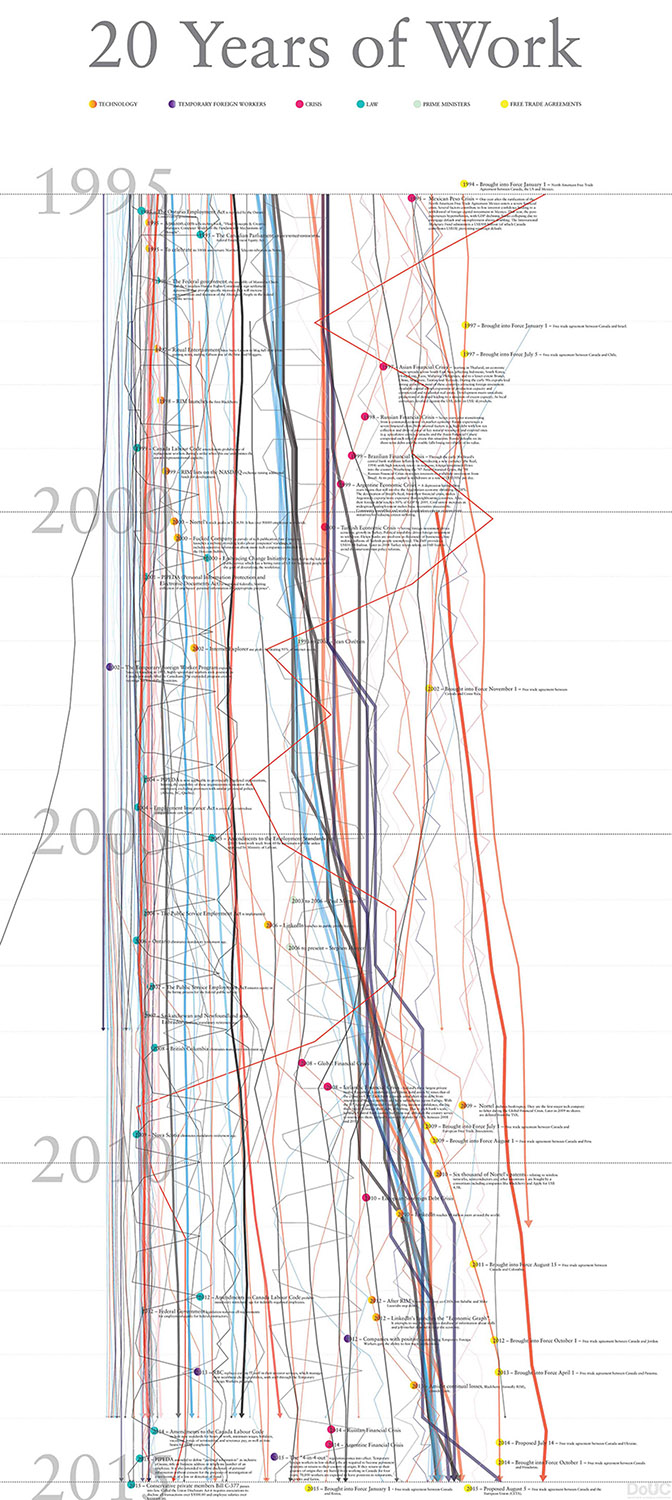
SR ⤳ We chose some factors because they were obvious (e.g. Technology), some because they were timely (e.g. Temporary Foreign Workers), and some because they helped root the project in Canada (e.g. Prime Ministers).
While Conde and Beveridge often stage photographs of workplaces, using narrative photography to explore conflict, hardships, and inequalities, we took the approach of trying to represent international historical forces shaping the conditions of work. The historical forces we chose to explore, some of which you’ve named above, are global. They entwine places, and in some instances, do so external to a political process. Between 1995 and 2015 common examples include the offshoring of manufacturing, as well as the expansion of shipping and logistics through the spread of ‘just-in-time’ supply chain management. Additionally, there is an observable consolidation of ownership. Through creating “Spaces of Negotiations” (WAHC, 2012) we saw how this played out for Canada’s steel industry, through its complete sale to international steel conglomerates between 2004-2011. In short, we saw the simple of worker/management, rooted in a single place, dissolving. While Conde and Beveridge’s contribution and 20 Years are two very different kinds of projects, operating at two different scales of analysis, it was satisfying to see them in conversation with each other.
In 2014, as we were developing 20 Years, Facebook bought WhatsApp for $1-billion USD while only having just 55 employees. This example brought into focus how the innovation economy facilitates the stark concentration of wealth—that wording feels too gentle. Other effects were becoming clear as well, including the seepage of work-time into every other area of life, including sleep. This includes banal things like email on your phone, but also the monetization of peoples’ attention. During this period, design was instrumentalized to create “maximum user engagement”, in other words behaviour forming and or addictive experiences. It extended to include the remaking of the workplace through gamification. Expansive surveillance of worker’s performance, paired with prompts, nudges, and rewards undermines a worker’s sovereignty in more personal and immediate ways than had previously occurred. Life itself had become a more complete site of extraction. The previous order—fought for by organized labour—of 8-hours of work, 8-hours of rest, 8-hours of sleep had unravelled. Fred Turner’s book “From Counter Culture to Cyber Culture” suggests that it unravelled well before 1995, at least for early tech contract workers, burning out as they built up their networks while continuously retraining in new programing languages. Bruce Sterling’s “The Epic Struggle for the Internet of Things”, published in 2014, presents a more focused discussion of these conditions in relationship to Google, Microsoft, Facebook, Amazon, and Apple as monopolies. Each of these moments describe the oversized influence forms of technology, created by these specific companies, have in determining the conditions of life. This is a small piece of the story narrated in 20 Years.
“Of course, how one chooses to measure something is anything but objective. Measurement reflects the values of the person or thing doing the measuring.”
Do you believe that this is a complete picture? If not, what are some other important factors you would have explored and included if you could?
CP ⤳ I never think anything we do is a complete picture. There are always things that offer more insight and understanding. For this project in particular I think if we had done a series of interviews with people and their perception of work and overlaid it with the data it could have made the project much richer. The first hand account of work from the perspective of people and communities and then contextualizing it visually with global trade agreements.
SR ⤳ These are far from complete pictures—nor do they strive to be. The choice to use and re-use chaotic line graphs is rhetorical. It positions the project in conversation with the charts and graphs of economists, and other folks who claim expertise in describing the economy and its trends. In 2015, while we were making this project, CBC Ideas aired an episode called “It’s the Economists, Stupid”. The episodes guests—economists and historians—set out an accessible, and scathing, critique of the discipline. The argument, in short, is that the use of math, specialized language, and visualizations are layers of obfuscation for making ideas that are anything but objective too obscure to argue with. The main guest focused on the role of economists in justifying new extraction projects in Australia and describes them as rhetoricians for hire. The visual language of the project plays with the authority, and dryness, of charts and graphs. On one panel they create a chaotic field of lines that crash into the ground, while on the other they are too many of them, each so similar, creating a monotone field.
All of this is to say that the project’s intent isn’t so straight forward as to merely provide a ‘complete picture’. Heidegger, in his essay “The Age of World Picture” theorizes a shift in how human’s know the world. The shift is a displacement of perspectival experiences of place (e.g. knowing the world by looking at it) towards its representation through objective instruments. This is a transition from an embodied qualitative experience of place, for which there is a clear point of view, towards a quantified external view. Of course, how one chooses to measure something is anything but objective. Measurement reflects the values of the person or thing doing the measuring. Amazon’s discrimination against female applicants, facilitated by machine learning algorithms, is one clear example. Amazon’s algorithm internalized its historic hiring bias and continued to enact it, although, I guess more efficiently…
While doing the research, did you find anything surprising? Did you encounter any difficulties? How did you navigate these and how did they shape your subsequent exploration and final result?
SR ⤳ We were approaching this as non-expert researchers. We aren’t labour historians, or any other discipline that might claim authority on this topic. As such, most things were surprising. Any discipline be it economics, economic history, or otherwise has a rich and bifurcated discourse. Entering that debate from the outside requires a lot of work, curiosity, the instinct that any researcher has, and in some instances a willingness to be superficial.
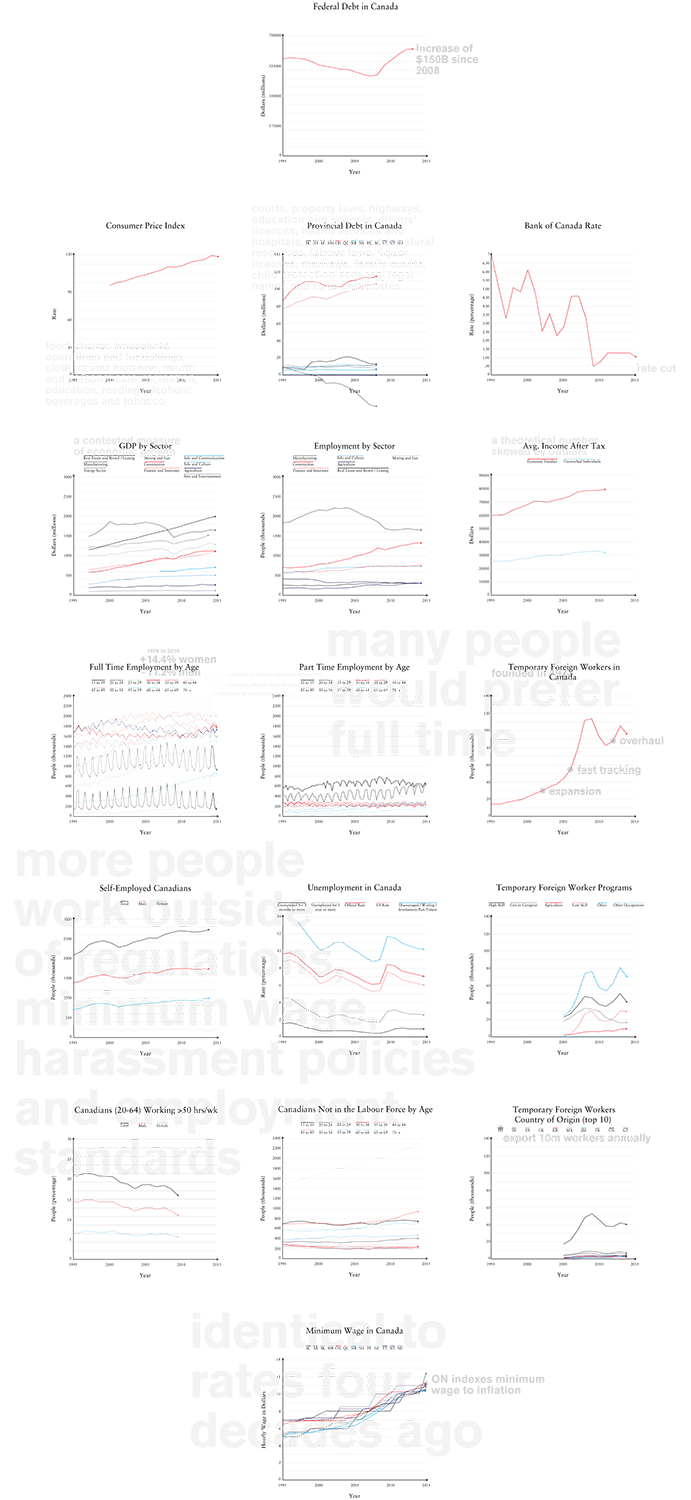
CP ⤳ I think one of the surprising things (although not surprising) was when we were looking at the GDP numbers and saw how real estate services as a top driver. This was at a time when the Toronto housing market was moving into the phase which can ultimately be described as chaotic. Like are you serious real estate services…Well today we know how serious it is. We know because if an industry associated with providing a basic human right (housing) is left to be used as a tool for economic growth it creates a situation of deep inequality and transforms how we as a society can even operate. How can you consider yourself as a nation state “developed” when people who work everyday can’t afford to have basic shelter. Listen, I know there are other complexities here and we could talk about all the other reasons all day…but to me it’s just that simple thought can make everyone understand that power cares about the accumulation of power and the tool of control can be used in many ways. The best way, convince everyone the market is over regulated from one perspective and meanwhile over regulate the market from another. What I mean is that the market is over regulated, and it is over regulated in favour of people with power and control and under regulated for the rest of us – the people.
In terms of difficulties. Data Visualization is hard LOL and it’s always important to experiment with how you want to show things. I think the final visualization that we settled on was very apt and it kind of looked like a series of cracks on a sheet of paper.
“In their original presentation they were each 7’ tall and hung touching the ground. Like in a painting, they offered different readings from different distances. Standing back, one projects an indecipherable chaos, while the other—the grid of bar graphs—order.”
How did you decide on this format of visualizing the timeline? Why was it the best choice?
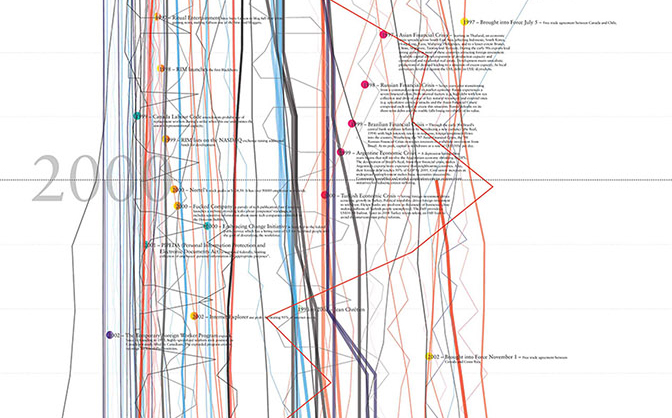
CP ⤳ There were two panels. The first panel was a series of the individual graphs that showed the different indicators. They were very simply designed and tried to mimic the aesthetic of a government report. We wanted to give a chance for everyone to see the individual statistics and be able to take each of the graphs in and use them as a discussion point. For the larger graphic we overlaid all the graphs on top of each other and rotated them and scaled them up to create a kind of glacier feeling with a series of cracks. The information was mapped out along these cracks to give a bit more insight. From a pure visual perspective I think graphs are viewed always in the same way where time is horizontal and numbers move vertically. This small shift in the design by changing the axis helped us to create a bit of chaos. A kind of poetic understanding of what it means for all these things to be happening and what their effect is on people and communities.
SR ⤳ Expanding on my initial comments about the form of 20 Years, these twin graphics were created for a physical exhibition, and that format can’t be overlooked. In their original presentation they were each 7’ tall and hung touching the ground. Like in a painting, they offered different readings from different distances. Standing back, one projects an indecipherable chaos, while the other—the grid of bar graphs—order. As one moves towards them other valences of information become legible, such as timeline entries with coded dots. The chaotic chart runs vertically, literally into the ground. Each timeline entry is floating in a dense field. A viewer, if they are to derive any interpretation, needs to read each graphic element in relationship to other contextual factors. In short, we were asking viewers to perform a lot of work.
As a worker in Canada, what did you learn about yourself through this project? How did it impact your life?
CP ⤳ What I learn about myself in all these types of projects is that I hate power. I hate it because it produces nothing of substance, it produces banality, it produces fear, it produces all the things that represent the worst parts of humans. The work I do has allowed me to meet and work with thousands of people (I feel very fortunate in my life for this. I am very lucky and privileged to be able to do this). All these people have beauty in them. I want to continue the work I do to try and build spaces where people can focus on bringing out that beauty that’s within them and share it and together build something with it. So fuck power and fuck the people that strive for it. It is empty.
What I am also learning about myself and everyday is what are the actions I can do to make sure that the allure of power is not part of my life and that the power I do have (because of course I do have it) I make sure to share and give and create opportunities and access for those who do not have it.
Looking at the time since the project was completed, how do you think the factors impacting labour and workers in Canada have shifted? How are things looking?
CP ⤳ Short answer – WORSE. Wages are stagnant, housing is more expensive, the list can go on. The key thing here is to understand that we are all workers. Work is not only about the money, it is about the value you have as a person through the way you help to build society. What you have to offer. The fact that all of us work for money alone is a shame. We are losing out so much from so many different people because of this. Work should be something that is part of your fulfillment as a person. We have created systems where the only reward is money and capital accumulation and let’s be honest it’s not reward it’s about surviving. We created a system where people work to barely survive, instead of creating a system where people work to fulfill their need to contribute their skills, thoughts and ideas to build society.
If you continued to build on this project, what kinds of factors would you add now? What has become more relevant? What has become less relevant?
CP ⤳ I would probably focus more on indicators that have to do with things like inequality and similar to what I had said earlier about people’s experiences. Taking information from those interviews and building the data bank of stats that could better illustrate those inequalities. For example including the total worth of stolen land from Indigenous populations (You know all of Canada) and throwing that into the mix. I would also like to investigate what the cost has been for systemic racism. For example all the talent lost, the wage gaps, the property loss, it can go on.
“I think when we made this we never dove deep enough with actual people and communities and this timeline was also left at an abstract level of the nation state in the context of a global economy. I think by doing some this work it could add another dimension and detail. It would kind of be like a compendium.”
Looking at current events, especially the pandemic and how it is affecting both front-line workers and marginalized communities in tremendous ways, which are often mutually inclusive, how would you include them in your exploration—where would you begin your exploration? What kinds of research would you do?
CP ⤳ I think my answer above. Maybe to add I would begin the exploration with talking to people and asking them to give the studio an oral history of their work experience(s), and when I mean experience, I mean their lived experience not like their resume…Using these stories could help us trace and track different statistics in different times that could help illustrate these stories in kind of redux of the project. I think when we made this we never dove deep enough with actual people and communities and this timeline was also left at an abstract level of the nation state in the context of a global economy. I think by doing some of this work it could add another dimension and detail. It would kind of be like a compendium.
SR ⤳ 20 Years’ methodology doesn’t reveal specific people or groups’ experiences. One strand of the timeline focused on Temporary Foreign Workers—a group deservedly receiving much discussion during Covid—but even then, the timeline focuses on policy rather than individual workers or farms. In this regard, it operates at the global scale, as mentioned above.
While 20 Years never zooms in, I’ve been experimenting with trans-scalar methods that situate extra-territorial conditions in relationship to specific settlements, and then places within those settlements. This work focuses on civilian drones as an enabling technology for different patterns of urbanization, as the car or elevator once were.
What are some other groups whose working lives are being currently impacted that you would want to explore? Why?
SR ⤳ “Voices from the Valley” (2020) is a recent book by Moira Weigel. It explores the lives of cleaners, nannies, and other personnel whose labour maintains Silicon Valley’s tech workers. Photography and interviews reveal the invisible work of this often-unseen class of workers.
Several years ago, there was a reckless proposal for an “Appropriation Award”. The basic argument for this hypothetical award was that it doesn’t matter who is telling a story as long as a wider range of experiences are represented. Instead of this approach, self-ethnography or autoethnography—people having control over when and how their own stories are told—is more recognized and celebrated as a respectful approach. During Covid this has extended to include the use of community specific forms of data e.g. covid infection rates within racialized communities. One aspect of that discussion is a suspicion about how or why a person external to a group should make a career using a story or data from another group. I admire the work of artist Stephanie Dinkins in her critical engagement with small data sets. Dinkins uses small data sets in the creation of machine learning chatbots that narrate her family’s history.
Last June I completed a series of interviews with an epidemiologist at UofT. It led to an article called “Right to the Model” published with Places Journal. I wanted to understand how the Province of Ontario used epidemiological models in their decision-making processes at the start of the pandemic. I wasn’t able to answer that question. Ultimately, the article documents the creation of one early Covid epidemiological model and discusses how people are, or are not, represented within it. While mathematical models present as objective, and external to human hands, the article resituates it as an authored thing in which the maker’s decisions shape how it performs—in short I wanted to explore the ethics of representation for an epidemiological model.
What kinds of changes would you like to see in the next 20 years? How can they be made possible?
CP ⤳ “The ultimate hidden truth of the world is that it is something we make and could just as easily make differently” David Graeber
SR ⤳ UBI, automation within a redistributive framework, degrowth…
Franco Berardi’s book the “Soul at Work,” describes the post-Fordist condition in which knowledge workers personally identify with their work and thus accept poor, temporary, and individuated conditions. In it he also theorizes a second strange condition in which everyone’s work looks somewhat similar. A lawyer, an economist, a front-end developer, a poet, and an accountant, while vastly different positions, have similar workdays… sitting at computers tapping away on keys. In reaction to this homogenization, I’m curious about the concept of technodiversity as put forward by media philosopher Yuk Hui. I don’t really know how to describe it other than to say a technology by other means. Why would “other means” be important? When designers make something to solve a problem, they are just creating the next problem. Every tool eventually wears out becoming another barrier. Media theorists like Vilhelm Flusser argued software was different; although now I think it’s generally recognized how spatially, materially, and energetically intensive the creation and operation of digital technologies are. The “Technosphere” (technology as a planetary system), first theorized in 1968, now has a calculated weight of ~30 trillion tons and growing. You’ve asked an ambitious question… my ambitious answer is to rethink computation as the basis for present-day, and future life. Technodiversity—technology by other means—as a concept perhaps opens a small crack for thinking about other kinds of tools and other kinds of uses.
Are there any groups or individuals currently working towards making these kinds of changes that you would like to give a shout out to? Any law-makers that you want to highlight so people can reach out to them?
SR ⤳ Lina Kahn’s work presenting why Amazon is a monopoly and why that is a problem has been important over the last few years.
Moria Weigel’s broader work looks at labour organizing in tech workers is also interesting. Tech workers are often described as culturally, and ideologically homogeneous. Her work draws attention to fractures in that image.